Recording Web Vitals with New Relic
How do you measure the performance and user experience of your website? Every change made can affect page loading speed, interactivity and visual stability. Together, these contribute to your product’s performance, search engine ranking, and advertisement performance. With New Relic, you can monitor these web vitals and be notified of user experience regressions.
Which main web vitals I should monitor?
From Google, their are several main web vitals you should focus on monitoring to evaluate how well users are experiencing your application.
- Largest Contentful Paint — How fast your application loads as perceived by the user.
- First Contentful Paint - The time it takes for the first content element to be painted on the screen in the user’s browser
- First Input Delay — How quickly your application responds to interaction with clicking a button, tapping a link, or using a form field.
- Cumulative Layout Shift — The visual stability of your application.
Together, these web vitals provide a holistic picture of the loading performance, interactivity, and visual stability of your application. Monitoring and improving these metrics can help your team create faster, visually stable, and highly interactive web applications.
A reasonable threshold to measure is the 75th percentile of each metric. This ensures you’re hitting the recommended target for most of your users. We use a percentile to understand the spread and distribution of data. Assuming your web application produces large amounts of data, there can be outliers which might skew the interpretation of the overall data distribution.
How do I record these metrics with New Relic?
Assuming you have New Relic’s browser monitoring enabled on your web application, then you should have access to the PageViewTiming event. This event represents individual timing events during a page view lifecycle, and offers valuable insights into how real users experience the performance of their website.
Largest contentful paint & first contentful paint
You can target the largest contentful paint and first contentful paint of your web application with the following query. It will select the 75th percentile of each metric, faceted by the page url. It will plot these value son a graph over the past month.
FROM PageViewTiming SELECT percentile(largestContentfulPaint, 75), percentile(firstContentfulPaint, 75) WHERE appName LIKE 'Your App Name' FACET pageUrl TIMESERIES MAX SINCE 1 month ago
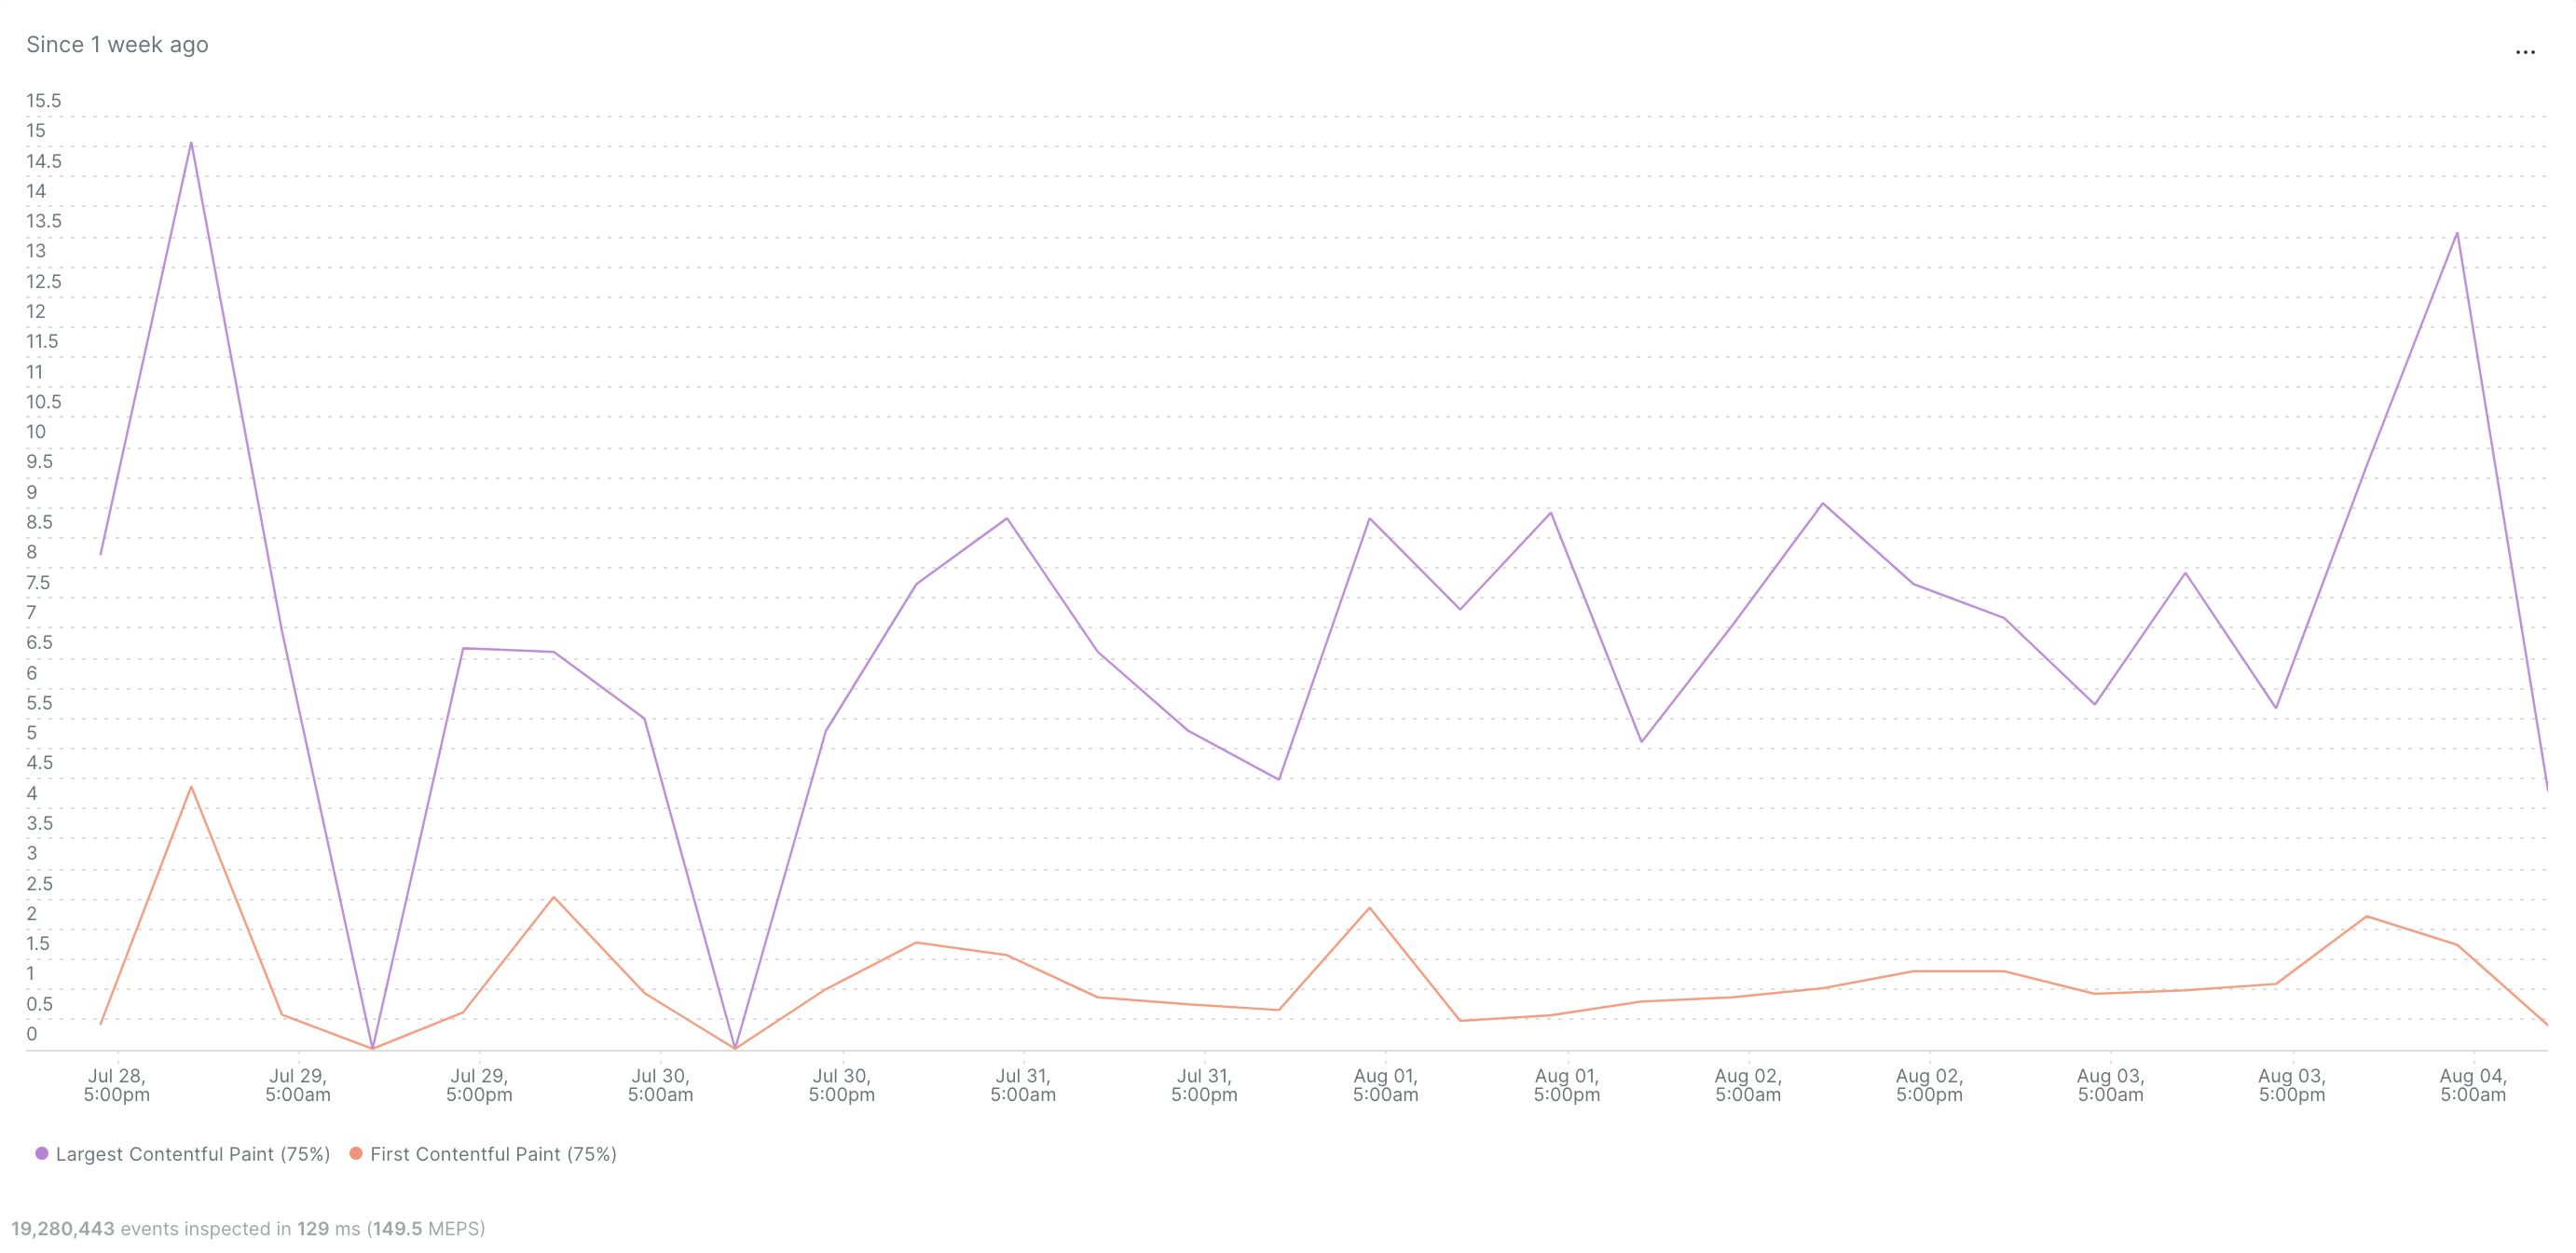
Knowing the FCP and LCP values showcases which time users see something loading on the screen, until the largest element on the page is finally rendered. Together, this reflects how quickly users can access the main content of the page. A lower score here score indicates a fast-loading page, leading to quicker engagement and reduced bounce rates from your site.
🧠 Hint! If you want to know the element which calculated largest contentful paint, then facet by the elementId and its size: FROM PageViewTiming SELECT percentile(largestContentfulPaint, 75) WHERE elementId != '' AND appName LIKE 'Your App Name' FACET elementId, elementSize TIMESERIES MAX SINCE 1 month ago
First input delay
Measuring the delay between the user’s first interaction on the site to the response of that interaction can be accomplished with the following New Relic NRQL query:
SELECT percentile(firstInputDelay, 75) as 'fid' FROM PageViewTiming WHERE timingName = 'firstInteraction' TIMESERIES FACET browserTransactionName, interactionType WHERE routePath LIKE '%condition-builder.create%' SINCE 1 month ago
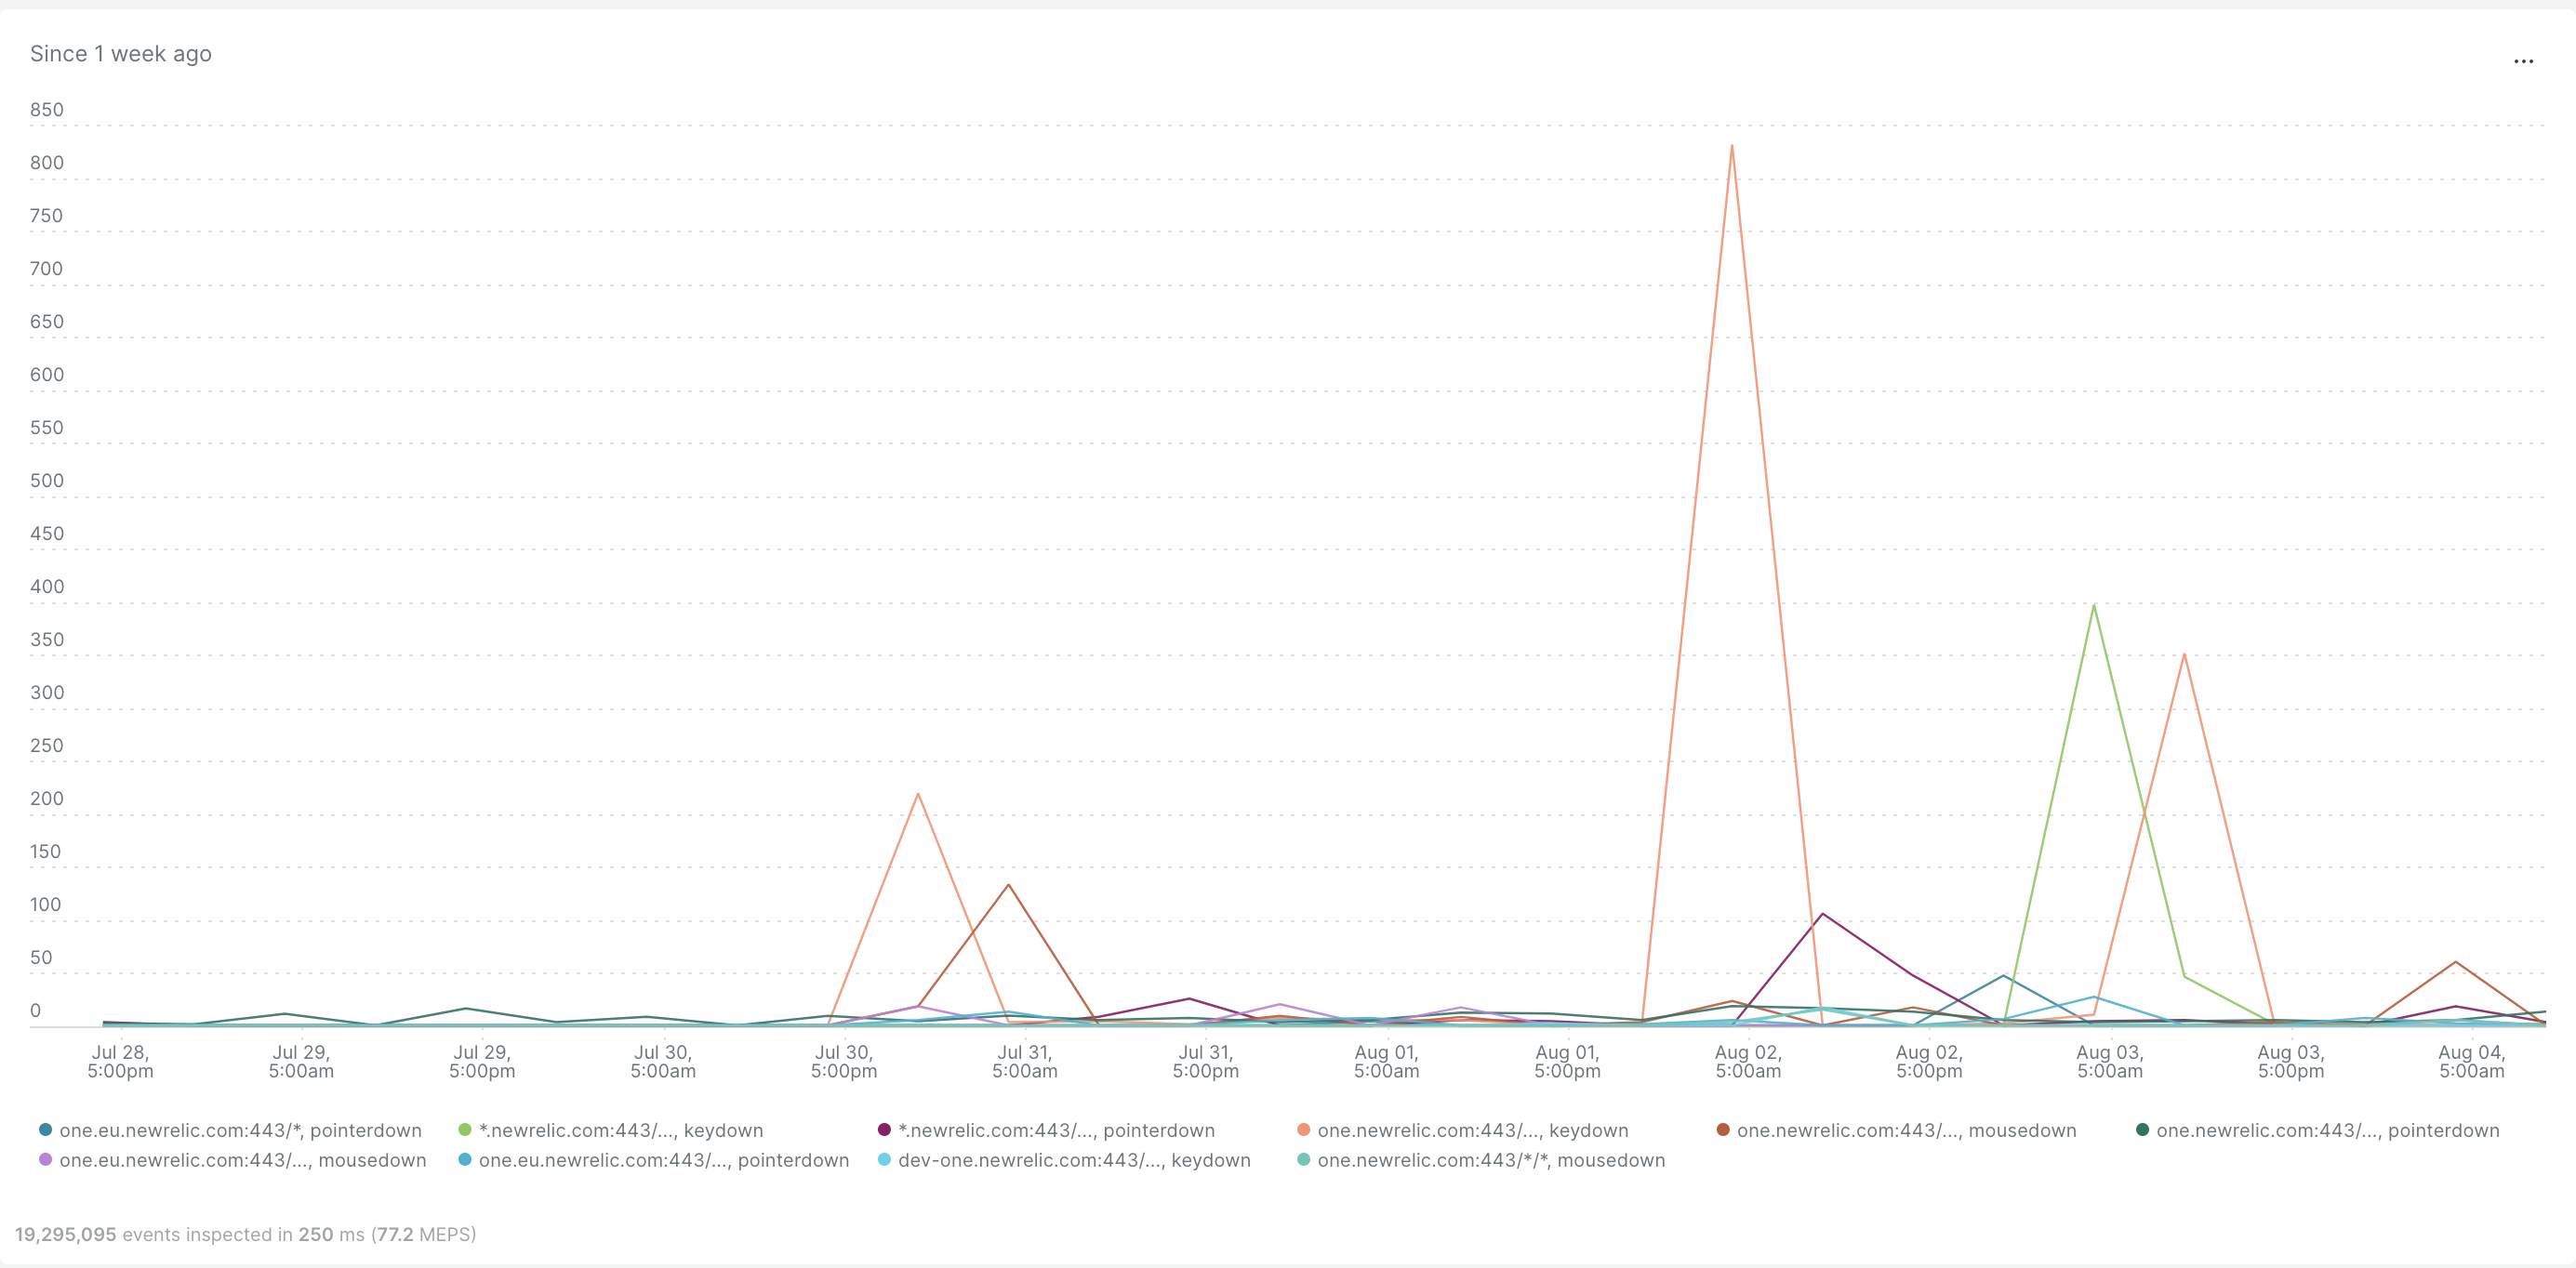
The First Input Delay value represents how smoothly and quickly a page becomes interactive. A good lower value means users can interact with the page without frustrating delays, resulting in a positive user experience.
How this works is a timer starts when the first user interaction occurs, like a mouse click or key press. The browser then checks if any long-running tasks are happening on the main thread. Once the main thread can begin processing event handlers in response to that interaction, then First Input Delay is calculated.
Cumulative Layout Shift
The visual stability during the entire lifespan of a page of your webpage is measured with Cumulative Layout Shift. Lower scores mean the page is visually stable when the web page is loading all text, images, and other parts of the document, and higher scores lead to more visually unstable experiences.
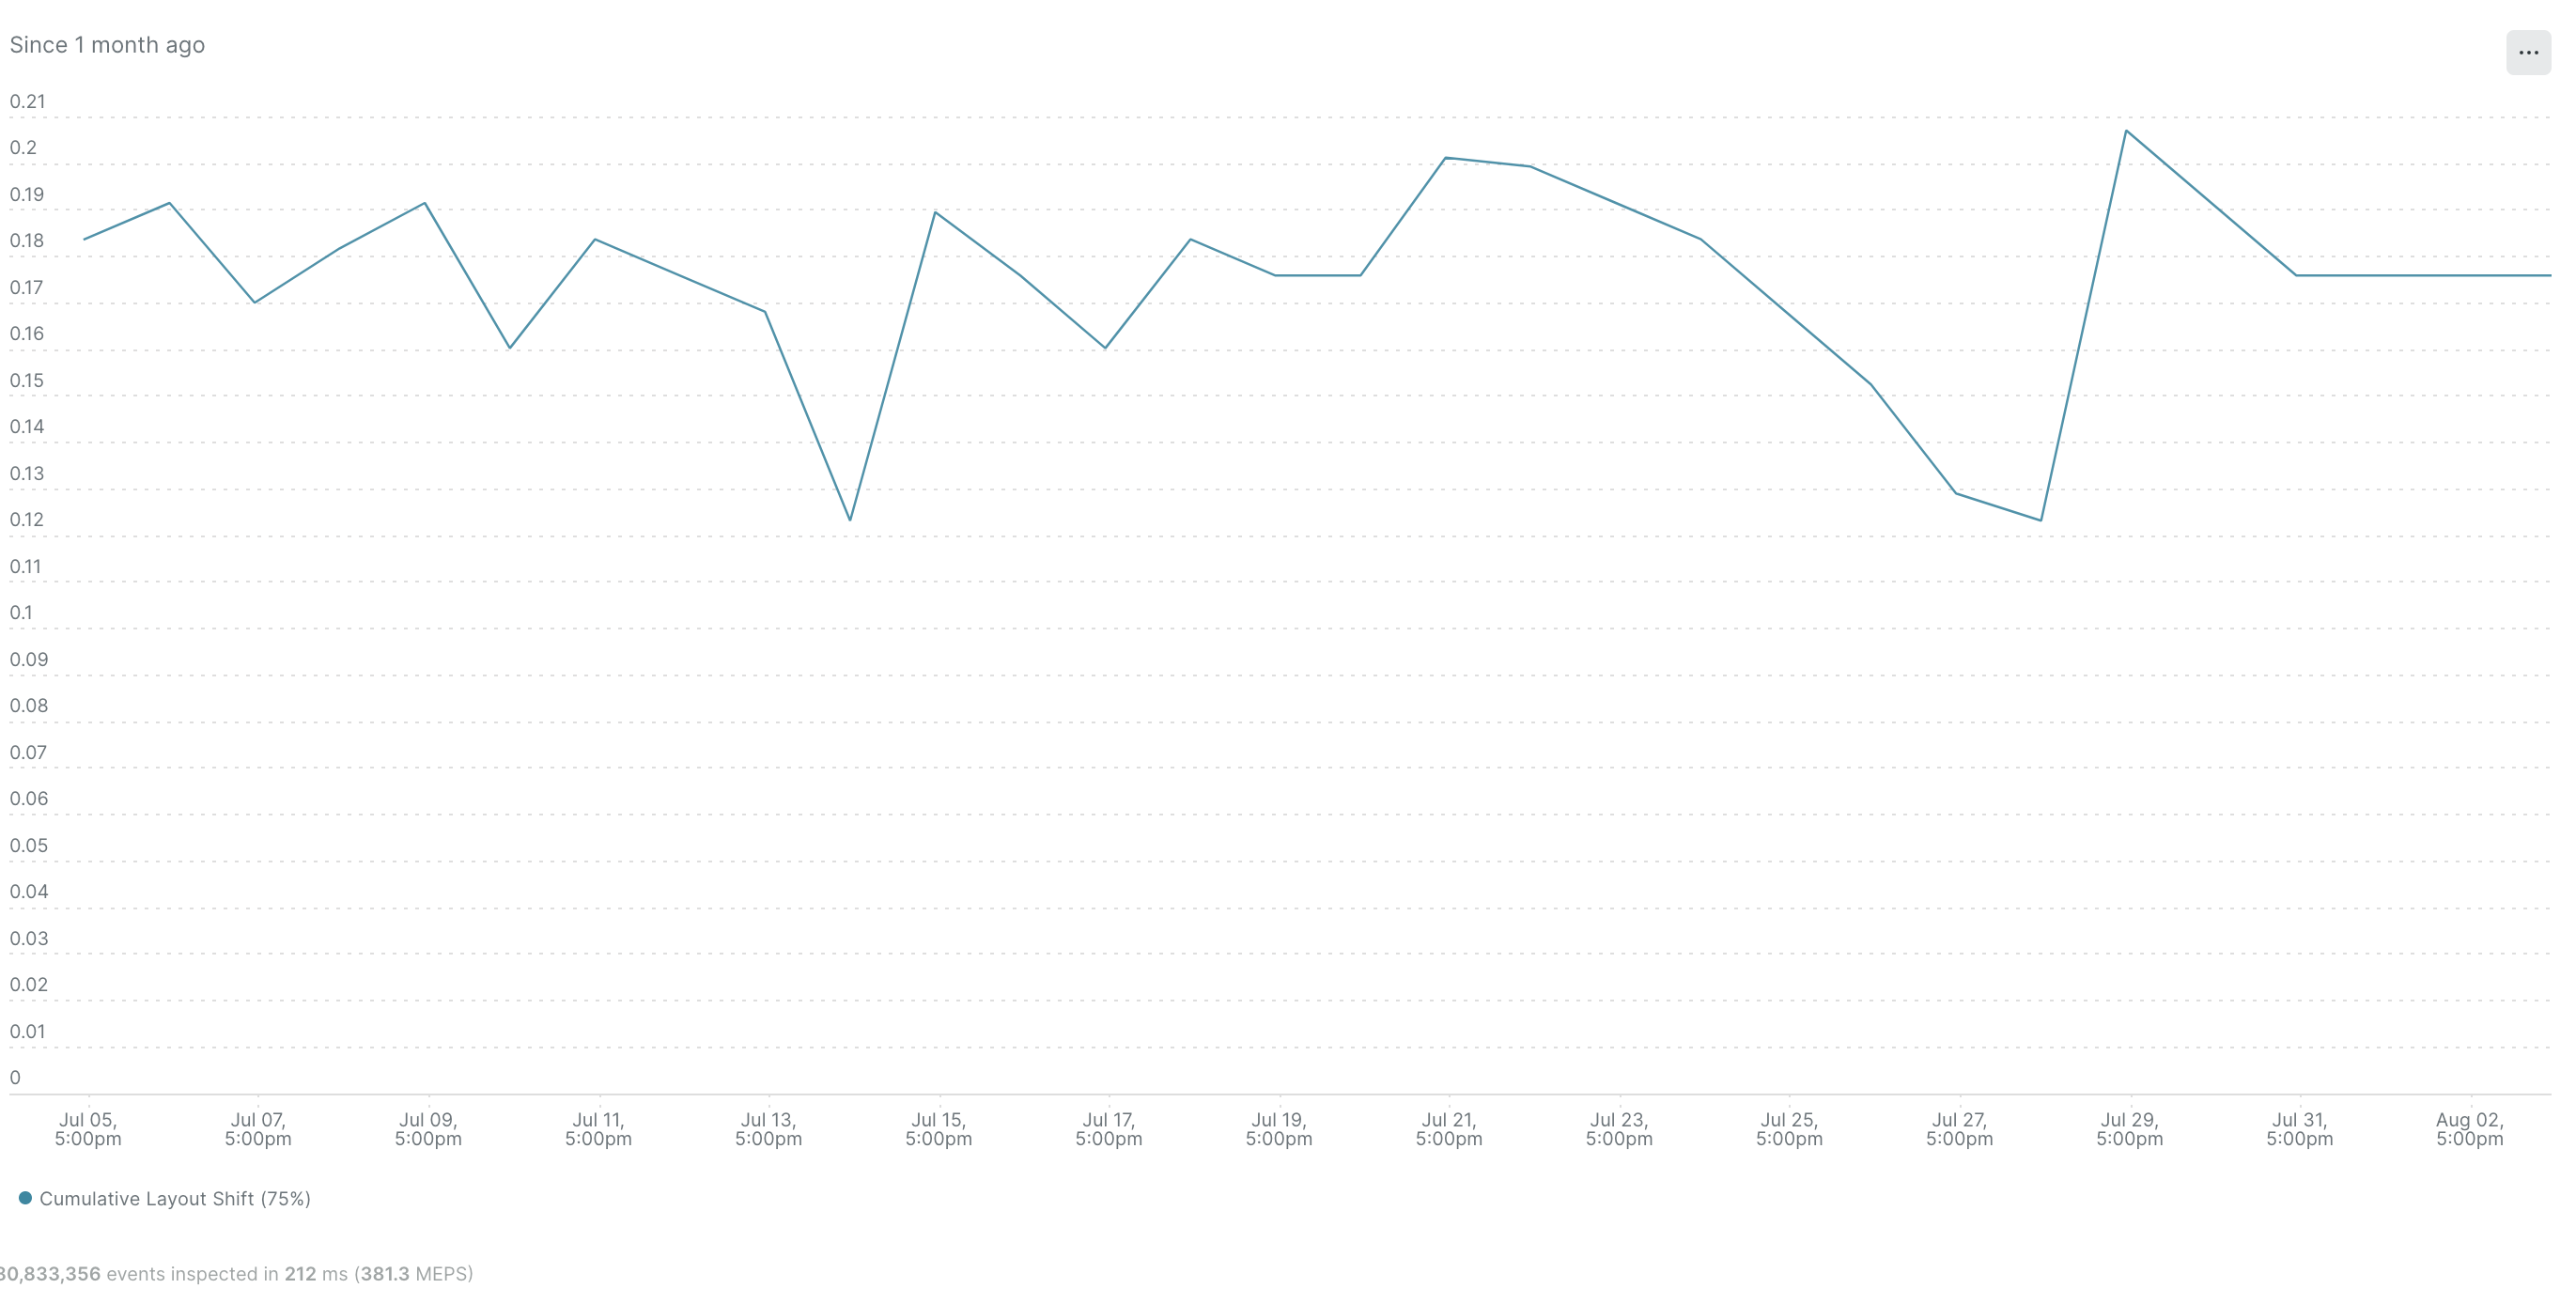
FROM PageViewTiming SELECT percentile(cumulativeLayoutShift, 75) WHERE appName LIKE 'Your app name' TIMESERIES SINCE 1 month ago
Cumulative layout shift represents all individual layout shifts that happen on the page. A layout shift occurs when elements change their start position. For example, When a new element is added to the DOM or an existing element changes size, and visible elements change their start position, then there is a cumulative layout shift.
How do I get notified when these web vitals are not meeting a threshold?
You can create New Relic alert conditions for your web application’s user experience. This guide is not focused on alert creation, so I will leave a link to the docs here. When a threshold is not met for any of the web vitals, you can diagnose the specific issue with your web page, make adjustments to the user experience, and continue monitoring your web application.